What a Trader.AI backtest report shows (and how to read it)
A Trader.AI backtest report is one page with four parts: the settings the test ran with, the headline numbers, the equity curve, and every trade. This article goes through each field and, more importantly, the order to read them in. The short version: settings first, drawdown second, return last.
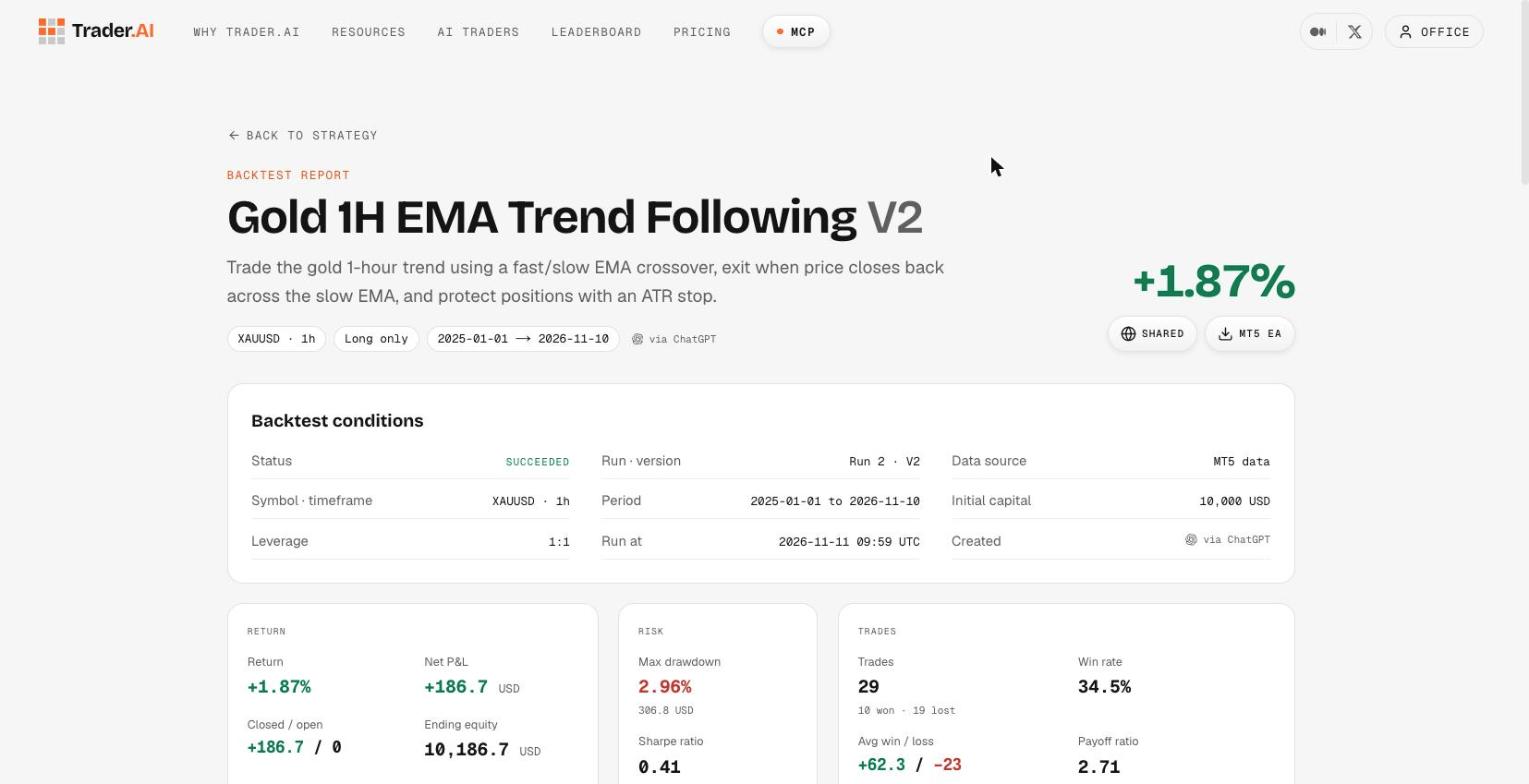
The examples below come from a real public report, a long-only EMA crossover on gold with an ADX filter: open it in another tab and follow along.
1. Settings: what was actually tested
At the top of the report:
- Strategy and version. Every change you make creates a new version; the report says which one ran.
- Symbol and timeframe. One of ten symbols, one of eight timeframes from 1 minute to 1 week.
- Date range. The exact window, so two reports can only be compared when the windows match.
- Starting balance, currency and leverage.
- Spread, commission and slippage. These are set per backtest and default to 0. A result with zero costs is an upper bound; before trusting a short-timeframe strategy, re-run it with your broker's real spread.
- The rules. Direction, entry rules, exit rules and risk controls, written out. If the rules on the report aren't what you meant, the result doesn't matter.
Read this block before any number. Most disputes about a backtest are settled here: wrong timeframe, zero costs, or a rule that got interpreted differently than intended.
2. Headline numbers
Return and ending equity. Net result over the whole window, after the costs above.
Max drawdown. The largest fall from a peak in equity to the next trough, in percent and in money. This is the number that decides whether you could have held the strategy through its worst stretch. An 8% return with a 4% drawdown and an 8% return with a 20% drawdown are not the same strategy.
Sharpe ratio. Return per unit of volatility. Useful for comparing two versions on the same dates; not meaningful on a handful of trades.
Trades, wins, losses, win rate. How many times the rules fired. Fewer than about 30 trades and every other number on the page is noise; widen the dates or drop to a shorter timeframe.
Average win / average loss. Together with win rate these explain where the return came from. A 39% win rate with wins twice the size of losses is a healthy trend strategy; a 75% win rate with losses four times the size of wins can give back months of gains in a single losing streak.
Profit factor. Gross profit divided by gross loss. Below 1 the strategy lost money; around 1.3–1.5 on a decent sample is worth a closer look; well above 2 on a small sample usually means overfitting or a lucky period.
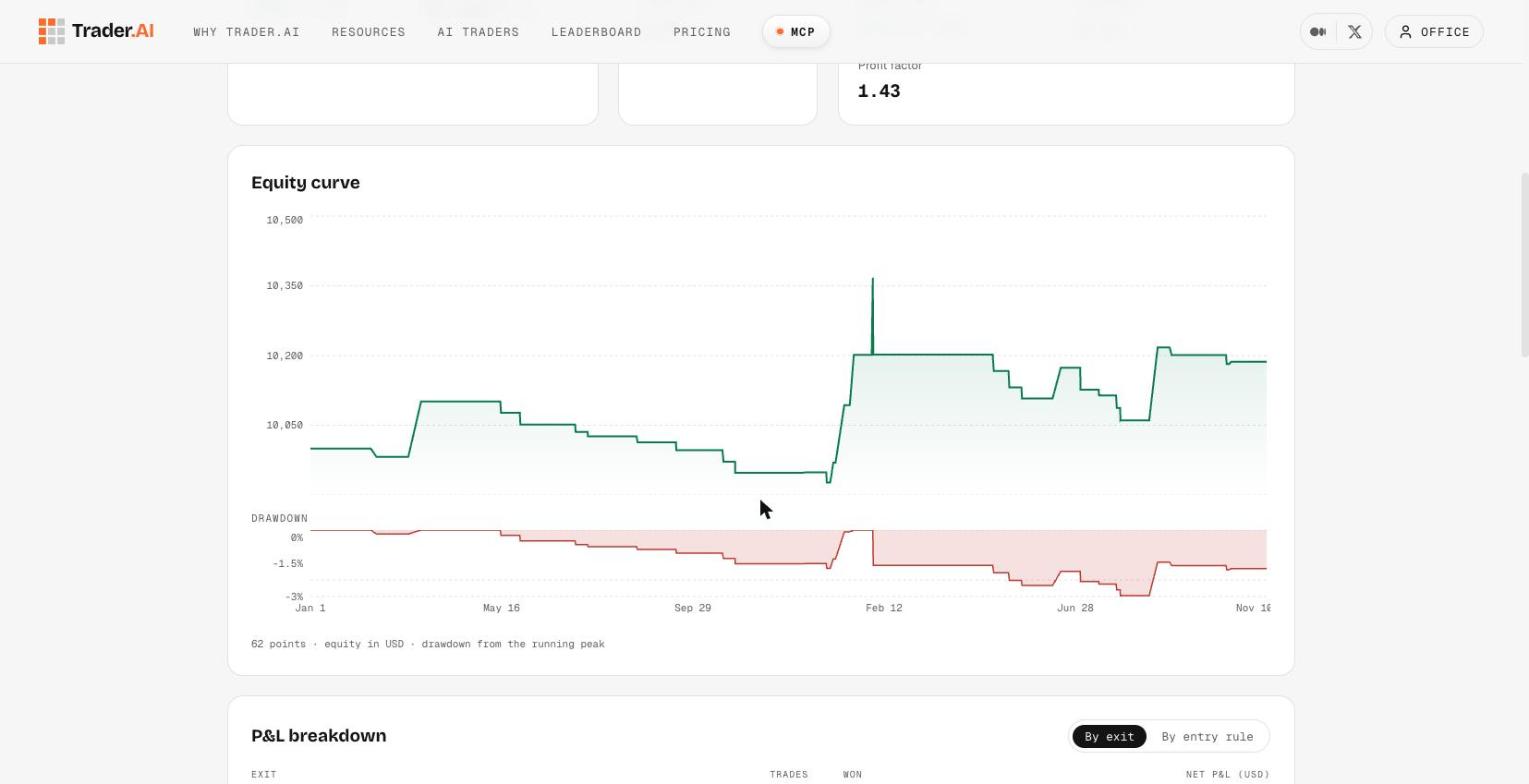
3. Equity curve
The equity line over time, with drawdown shaded underneath. Two things to look for:
- Shape. A steady slope with small dips is what you want. A flat line with one vertical jump means one trade made the result.
- Where the drawdown sits. A drawdown at the end of the window is a strategy that may have stopped working; one in the middle that recovered is just a bad month.
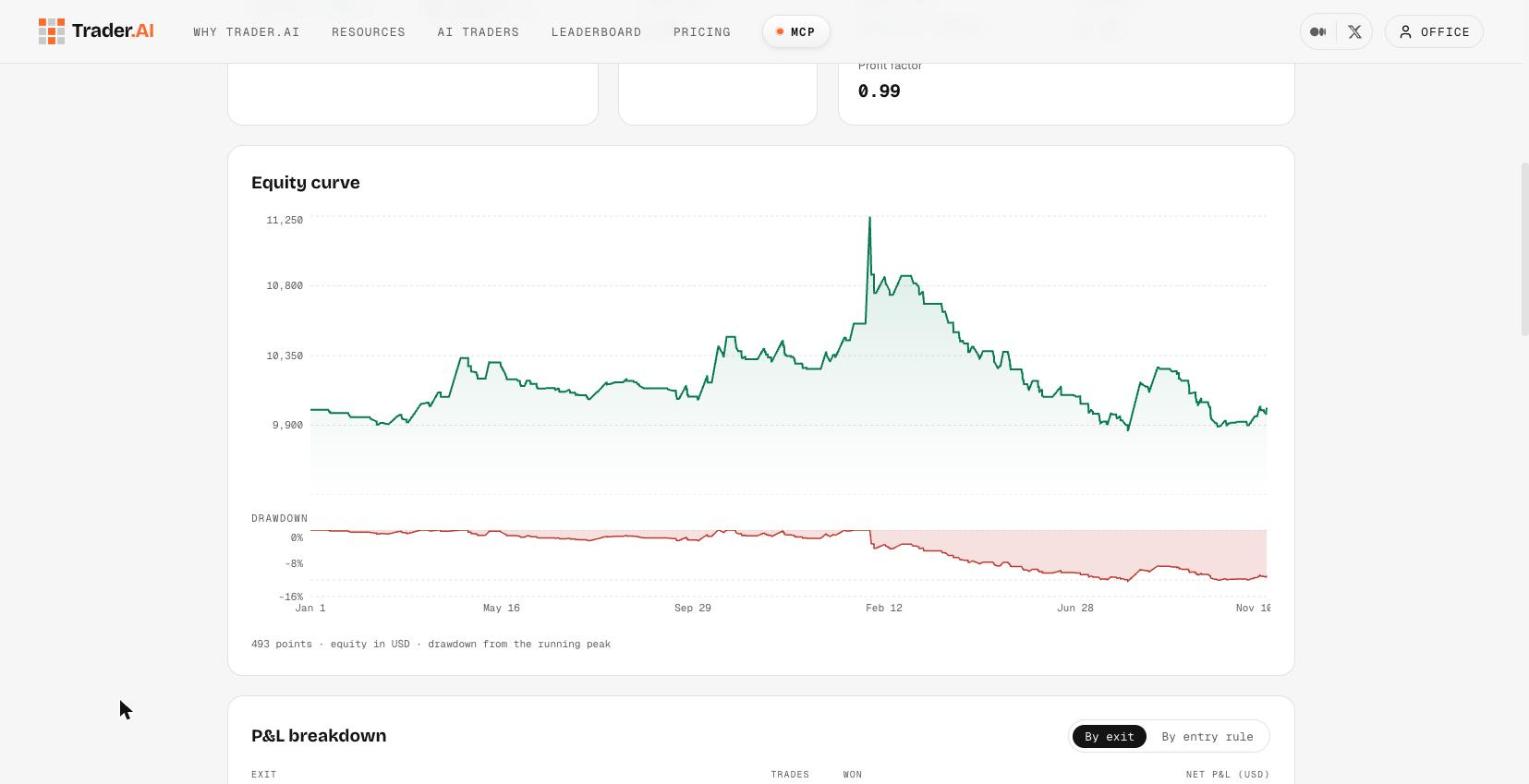
For contrast, version 1 of the same strategy, long and short with no filter, has a curve that climbs to a spike in February and gives it all back: the same return of roughly zero, but a 12.3% drawdown along the way.
4. Breakdown and trade list
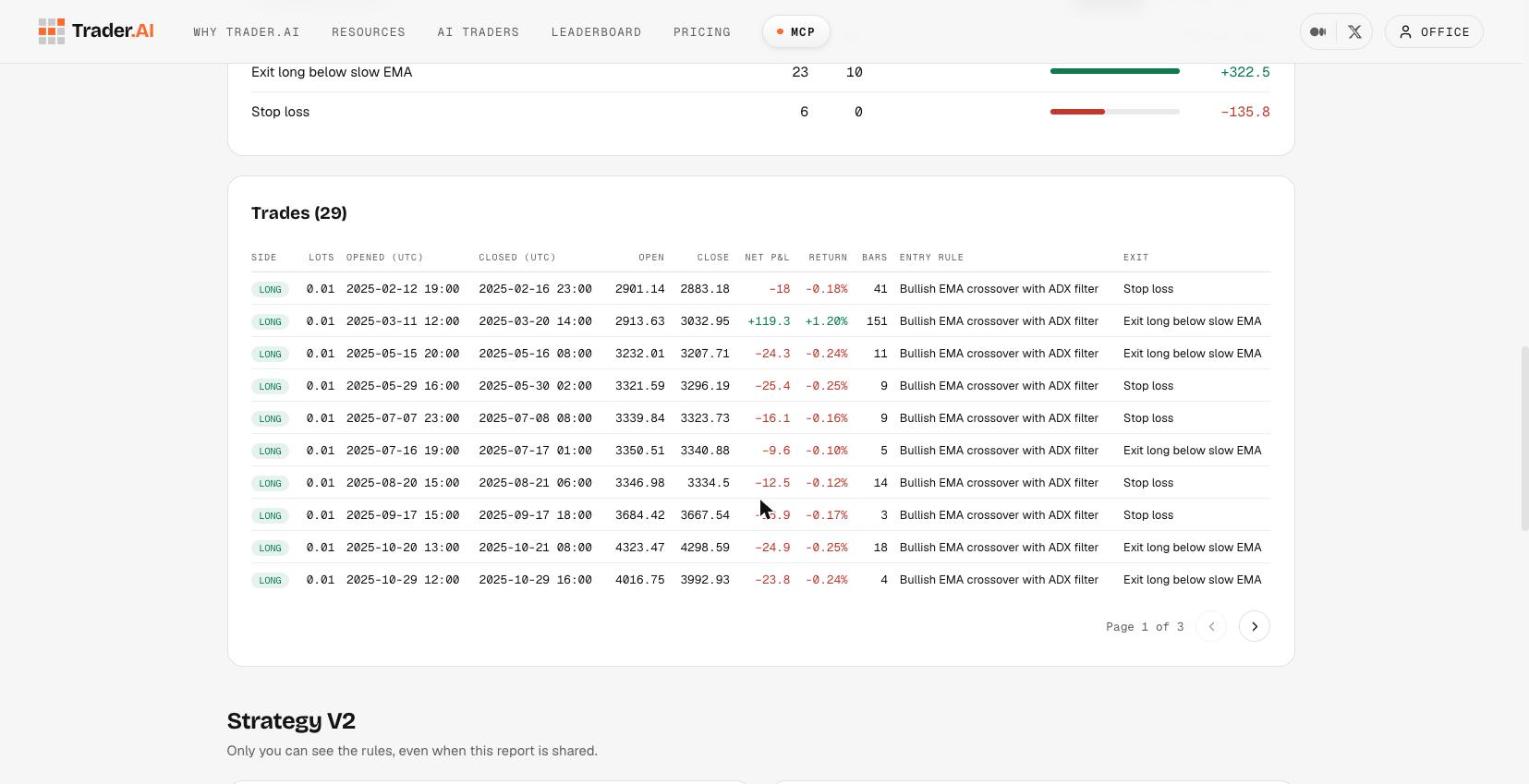
By exit reason. Trades grouped by how they closed: stop loss, trailing stop, take profit, time stop or an exit rule, each with its count, wins and net P&L. If most of the loss comes from time stops, the strategy is holding trades it should have cut. If most of the profit comes from take-profits and most of the loss from stops, the ratio between the two is the lever to pull.
By entry rule. The same grouping by the rule that opened the trade, when the strategy has more than one. A rule that loses on its own gets removed.
Every trade. Direction, size, open and close time, open and close price, net P&L, bars held, entry rule and exit reason. This is what makes the report checkable: anyone with the link can see the same trades you see.
The order to read a report in
1.Rules and costs. Is this what you meant to test, with realistic costs?
2.Trade count. Enough trades to mean anything?
3.Max drawdown. Could you have sat through it?
4.Win rate against average win/loss. Where does the return come from?
5.Equity curve shape. Steady edge or one lucky trade?
6.Breakdown. Which exit or rule is doing the damage?
7.Return. Last, because it only means something once the first six check out.
What a report can't tell you
How the strategy will do next month. Costs, slippage, data gaps and markets that change after the test window all sit between a backtest and a live account. The report shows its work so you can judge the evidence; it doesn't turn evidence into a guarantee. Run survivors on a demo account before real money.
Frequently Asked Questions
Are Trader.AI backtest results real trading results?
No. They're hypothetical: how the rules would have traded on historical MT5 data with the costs you set. They don't guarantee future results.
Why does my report say spread 0?
Because spread, commission and slippage default to 0 and are set per backtest. Ask your AI to re-run with your broker's spread; the report will state the costs it used.
Can other people see my report?
Only if you make it public. A public report shows the settings, numbers, equity curve and trade list, never the strategy's rules.
What's a good profit factor?
Above 1 is profitable; 1.3–1.5 on a decent sample is worth a closer look. Very high numbers on few trades usually mean the test was too easy.
Related Resources